


In this article, we explore the performance of publicly listed Bitcoin miners in April 2025, comparing their results to March and analyzing their relative positioning in the competitive landscape.
Our analysis focuses on three critical dimensions: operational scale, energy efficiency, and the shift from Bitcoin accumulation to strategic selling. By examining key metrics across these dimensions, we gain valuable insights into the various strategies miners are employing, the challenges they face in an increasingly competitive environment, and the factors influencing their success or underperformance.
April presented a dynamic market characterized by significant Bitcoin price growth. Miners responded with varying approaches: some aggressively expanded their capacity, while others encountered production challenges despite the favorable price action. Perhaps most notably, we observed a substantial shift in treasury management strategies, with several major players breaking their long-established accumulation trend in favor of more dynamic capital allocation methods.
Before examining miner performance, let’s first review the general market developments in April.
Market Conditions
In April 2025, Bitcoin maintained its upward trajectory with a significant price increase of 14.43%. The network’s fundamentals strengthened considerably, with hashrate rising by 8.32%, resulting in a month-end mining difficulty of 123.23 T.
Value End of April | Monthly Change | |
Bitcoin Price | $94,236 | +14.43% |
Difficulty | 123.23 T | +8.32% |
Hashprice | $48.93/PH/day | +6.66% |
Bitcoin Dominance | 63.5% | +3.59% |
Due to Bitcoin’s price outpacing difficulty, we observe a 6.66% increase in hashprice, improving miners’ profitability conditions. However, it is still relatively low at $48.93/PH/day.
Bitcoin’s dominance in the broader cryptocurrency market continued to strengthen, increasing by 3.59%. This trend suggests continued capital flow into Bitcoin relative to altcoins, which could further support prices and positively influence mining returns.
These metrics collectively indicate robust market conditions despite the significantly increased difficulty, which may present challenges for less efficient operations.
All that in prospect, you can ask our team of experts for a better understanding on where Bitcoin Mining is, and how it can be an additional value to your portfolio.
Production and Treasury Management
In April 2025, we observe several notable trends in the mining performance of major industry players:
Marathon Digital (MARA) continues to lead the sector with high Bitcoin production (705 Bitcoin) and the largest hashrate deployment (57.3 EH/s). However, their production declined by 15% month-over-month, despite a 6% increase in hashrate.
The most impressive growth story comes from Bitdeer, which increased its Bitcoin production by a remarkable 46%.
Iren also reports very positive figures, with a 9% increase in Bitcoin production and a 21% expansion of its hashrate.
Bitcoin Mined | Change MoM | Hashrate (EH/s) | Change MoM | Efficiency (J/TH) | Bitcoin HODL | Change MoM | |
MARA | 705 | -15% | 57.3 | 6% | 19.3 | 48,237 | 1.49% |
Riot | 463 | -13% | 29.3 | -3% | 21 | 19,211 | -0.06% |
Iren | 579 | 9% | 36.60 | 21% | 15 | 0 | 0.00% |
Cleanspark | 663 | -6% | 40.1 | -5% | 16.98 | 12,101 | 1.95% |
Bitdeer | 166 | 46% | 12.40 | 8% | 29 | 1,246 | 7.79% |
Bitfarms | 268 | -4% | 17.2 | 5% | 19 | 1,005 | -11.84% |
DMG | 30 | -6% | 1.93 | 6% | 23 | 351 | -23.36% |
Hive | 102 | -6% | 6.5 | 5% | 20.7 | 610 | -72.29% |
Soluna | 10 | -17% | 0.664 | -9% | 26 | 0 | 0.00% |
The HODL strategies reveal significant shifts in treasury management. Marathon continued its Bitcoin accumulation strategy with a 1.49% increase to 48,237 Bitcoin on its balance sheet. In contrast, several miners started to decrease their holdings; for example, Hive reduced its reserves by 72.29%, DMG by 23.36%, and Bitfarms by 11.84%.
This marks a significant reversal of the month-long trend where miners predominantly have been accumulating Bitcoin. Some miners are now utilising their Bitcoin holdings.
Hive, for example, disclosed that they “strategically deployed a portion of its Bitcoin treasury to acquire next-generation ASIC mining equipment through a special agreement.” The company pledged Bitcoin at a market price of US$87,000 per Bitcoin while securing an option to repurchase the equivalent amount at the same price. This creates a unique opportunity to capture potential upside in Bitcoin price appreciation while Hive can simultaneously upgrade its mining infrastructure.
This approach to asset utilization demonstrates how miners are developing more sophisticated capital allocation strategies beyond a simple “HODL, sell or buy strategy.”
Strategic Positioning
The relationship between scale (hashrate) and efficiency (energy consumption per hash) reveals distinct competitive positions in the Bitcoin mining ecosystem. The “Efficiency vs. Scale” chart for April 2025 provides a visual snapshot of how leading miners are positioned. It shows the positions of the miners in March as well as in April:
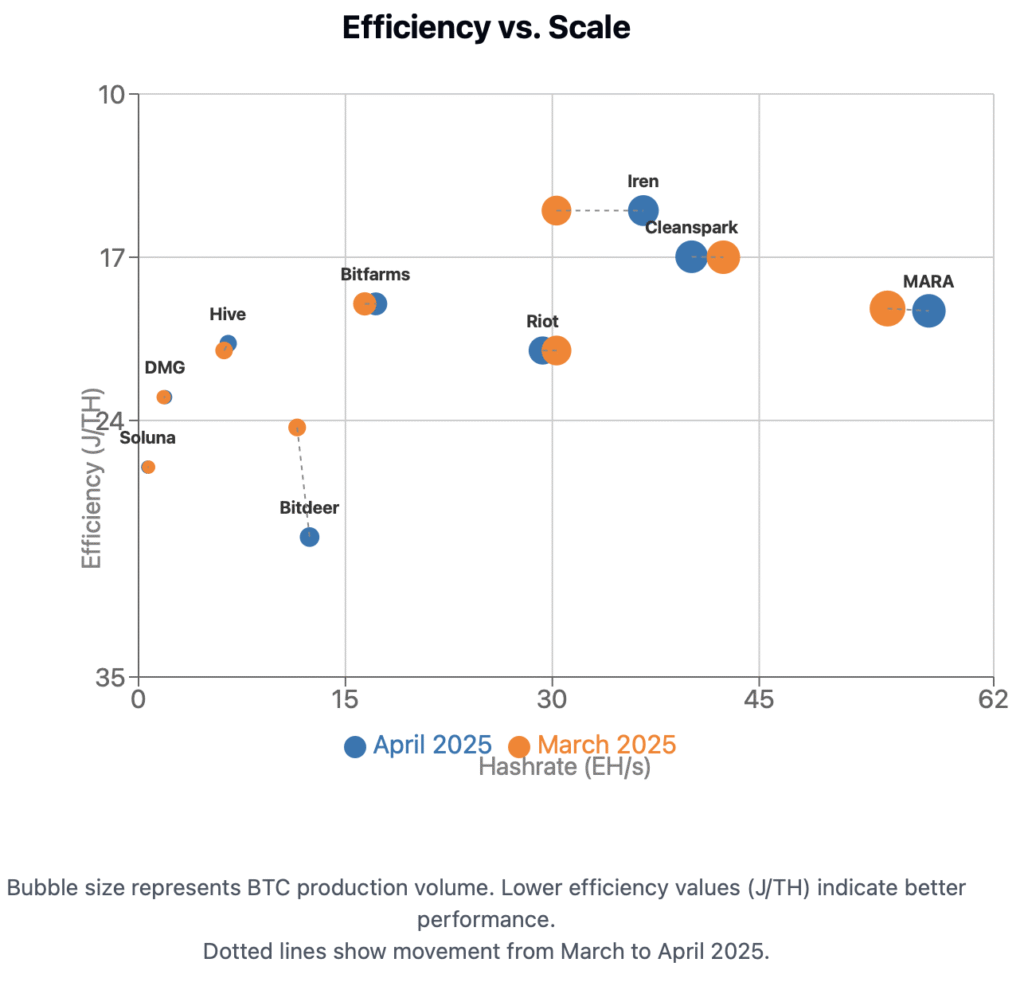
Efficiency Leaders: Iren stands out with the best energy efficiency (15 J/TH) while deploying a significant amount of hashrate (36.6 EH/s). This strong combination positions Iren exceptionally well as mining difficulty increases. Cleanspark, positioned closely, combines high efficiency (16.98 J/TH) with substantial scale (40.1 EH/s).
Scale Leader: Marathon Digital (MARA)‘s dominance in hashrate is immediately apparent, maintaining reasonable efficiency of 19.3 J/TH.
Balanced Performer: Riot holds a central position, indicating a more balanced approach between scale and efficiency, though it experienced a slight reduction in hashrate to 29.3 EH/s (-3%).
Growth Standout: Bitdeer demonstrates notable improvement in scale with an 8% hashrate increase. While currently operating at a relatively high energy consumption (29 J/TH), Bitdeer is actively addressing this challenge through vertical integration. The company recently announced, “With our SEALMINER mining rigs quickly coming off the production line and ample global power capacity available, we expect to achieve rapid growth in our self-mining hashrate towards our 40 EH/s target by October 2025.” Most importantly, their ambitious R&D roadmap targets “an unprecedented chip efficiency of approximately 5 J/TH at the chip level” with their SEALMINER A4 project scheduled for completion in Q4 2025.
Looking at the month-to-month metrics, several key shifts emerge that reflect differing strategic approaches:
Divergent Production Results: Seven of the nine miners analyzed saw declines in Bitcoin production.
HODL Strategy Shifts: The substantial decrease in Bitcoin holdings by several miners indicates a strategic move toward liquidity, among other reasons, to support operational costs or expansion efforts.
Efficiency vs. Growth: While efficient Iren (15 J/TH) achieved a 9% production growth, the less efficient Bitdeer (29 J/TH) managed 46%.
While network difficulty rose substantially by 8.32% in April, Bitcoin’s price increase of 14.43% more than compensated for this, improving overall mining profitability. Nevertheless, efficiency remains a crucial competitive factor. The clustering of leading miners between 15-21 J/TH creates a notable advantage compared to those operating at 23 J/TH or higher. This efficiency gap could become more significant for profitability if future difficulty increases outpace Bitcoin price growth.
Concluding Remarks
In summary, April 2025 saw slightly improved market conditions compared to March, alongside diverse miner strategies. Bitcoin’s price increased by 14.43%, outpacing the 8.32% rise in mining difficulty.
Despite these improvements, miners showed varying results. Production outcomes ranged from Bitdeer’s notable 46% growth to production declines by seven other miners. Similarly, efficiency metrics span from Iren’s leading 15 J/TH to Bitdeer’s 29 J/TH, reflecting different technical approaches and infrastructure investments across operations.
Our analysis reveals a mining landscape where scale, efficiency, and strategic agility remain critical success factors. The approaches we have examined, such as Iren’s efficiency focus, Marathon’s scale advantage, and Bitdeer’s vertical integration, represent distinct paths through the current market challenges. Meanwhile, the shift in treasury management by miners like Hive indicates an increasing sophistication in miners’ capital allocation.
Miners who effectively use all available tools are likely to be best positioned for sustainable growth. This includes managing Bitcoin treasury and capital deployment strategies, dynamically adapting to market volatility, and optimizing mining efficiency and scale for medium- to long-term success.