


Valuing Public Bitcoin Miners: A Production-Based Comparison
Public Bitcoin miners represent a substantial portion of the global Bitcoin network’s hashrate, making them crucial players in the Bitcoin ecosystem. As publicly traded companies, their stock prices reflect both their current operations and future potential and other business-related parts.
But how can investors effectively evaluate these companies’ performance and determine if their valuations are justified?
Comparing mining companies presents unique challenges, as each operation has different equipment deployments, power contracts, and operational strategies. Moreover, recent trends show miners diversifying their business models beyond pure mining operations (venturing into artificial intelligence data centers, actively buying Bitcoin and more), adding another layer of complexity to their valuations.
In the previous article “Introducing the GreenBlock Software Solution: Revolutionizing Bitcoin Mining Exposure” we introduced our GreenBlock Bitcoin mining solution – a standardized, risk-minimized approach without the physical Bitcoin mining risk.
In this article we will use our GreenBlock mining solution as a benchmark for comparing miners’ Bitcoin production relative to the investment required in their stock to get a similar amount of Bitcoin mined.
The Bitcoin Mining Landscape and Production Analysis
The April 19th, 2024 Bitcoin halving, which reduced the block reward from 6.25 to 3.125 bitcoin, significantly impacted miners’ production.
Table 1: Bitcoin mined each month
Only three of the miners considered here – Riot, Iren and MARA – have managed to increase their Bitcoin production post halving compared to March before the halving, with MARA only exceeding pre-halving production levels again in November, but not this December.
While absolute production numbers tell us something important about miners’ investment behavior and capabilities, they don’t provide the complete picture.
What is more relevant for an investor into a public miner is the exposure you are getting to the Bitcoin mined for every Dollar invested into a company’s stock.
GreenBlock as Production Benchmark
In this analysis, we utilize our GreenBlock Solution as a standardized benchmark to evaluate public miner efficiency.
For our GreenBlock contracts, we specify electricity costs of $0.055/kWh, 90% operational uptime, and deployment of S21 miners. At the beginning of each month, we calculate what hashrate and subsequent Bitcoin production a $100,000 investment would yield under these parameters, utilizing the Luxor Hashprice Index for our calculations.
We compare gross Bitcoin production before costs, using GreenBlock Solution as a consistent baseline for evaluating public miners.
This standardized approach through our GreenBlock Solution enables a precise evaluation of public miners relative to a consistent baseline. We determine each public miner’s implied hashrate from their monthly Bitcoin production assuming the same parameters as for the GreenBlock solution. Based on this, we calculate the investment required in each company’s stock to achieve hashrate parity with our GreenBlock Solution. To facilitate the comparison, we express the data as an investment multiple of our GreenBlock benchmark.
As an example, when the multiple equals two, it indicates that achieving an equivalent Bitcoin production through an investment in that particular mining company’s stock would require twice the capital compared to our benchmark GreenBlock subscription.
While a higher multiple doesn’t necessarily indicate that the miner is expensive or inefficient —as stock prices reflect various factors such as Bitcoin holdings and future miner orders—this metric provides a standardized way to evaluate how effectively each public miner converts investor capital into Bitcoin production.
The resulting multiples, shown in the charts at the end of this article, require careful interpretation as several factors influence mining company valuations. One increasingly significant factor in 2024 is Bitcoin holdings, whether accumulated through retained mining rewards or active purchasing via convertible senior notes (following a strategy similar to Michael Saylor’s approach).
When investors purchase mining company shares, they acquire exposure to both mining operations and Bitcoin holdings. Consequently, substantial Bitcoin holdings typically increase a company’s stock price and, by extension, its multiple relative to our benchmark if not accounted for.
Ready to transform your mining strategy?
Our innovative approach to earning Bitcoin provides optimized exposure to mining returns without the traditional operational headaches.
Adjusting for Bitcoin Holdings
Some companies sell all their mined Bitcoin, others retain a portion, and a growing number actively purchase Bitcoin, adding complexity to their valuation.
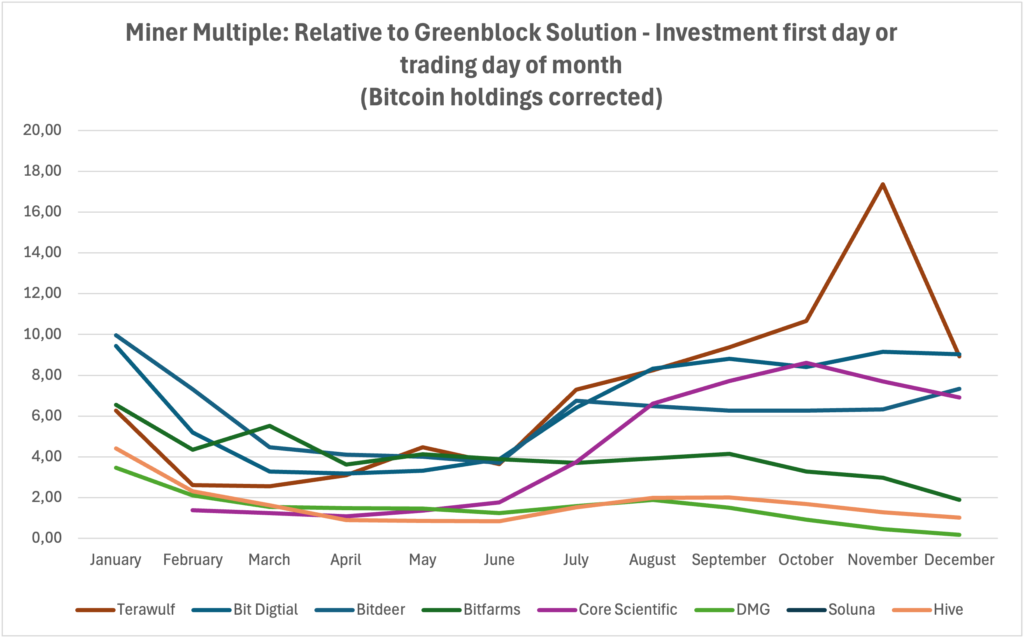
Graph 1: Bitcoin Miner Valuation I (Bitcoin Holdings Corrected)
To better evaluate operational efficiency, we adjust for Bitcoin holdings by:
- Quantifying Bitcoin Holdings Per Share
For each company, we calculate the value of Bitcoin held per share by multiplying their Bitcoin holdings by the Bitcoin price at the start of each month. - Adjusting Stock Price
We subtract the Bitcoin-backed value per share from the stock price. This gives an adjusted price bringing us closer to what investors are paying for the mining operations.
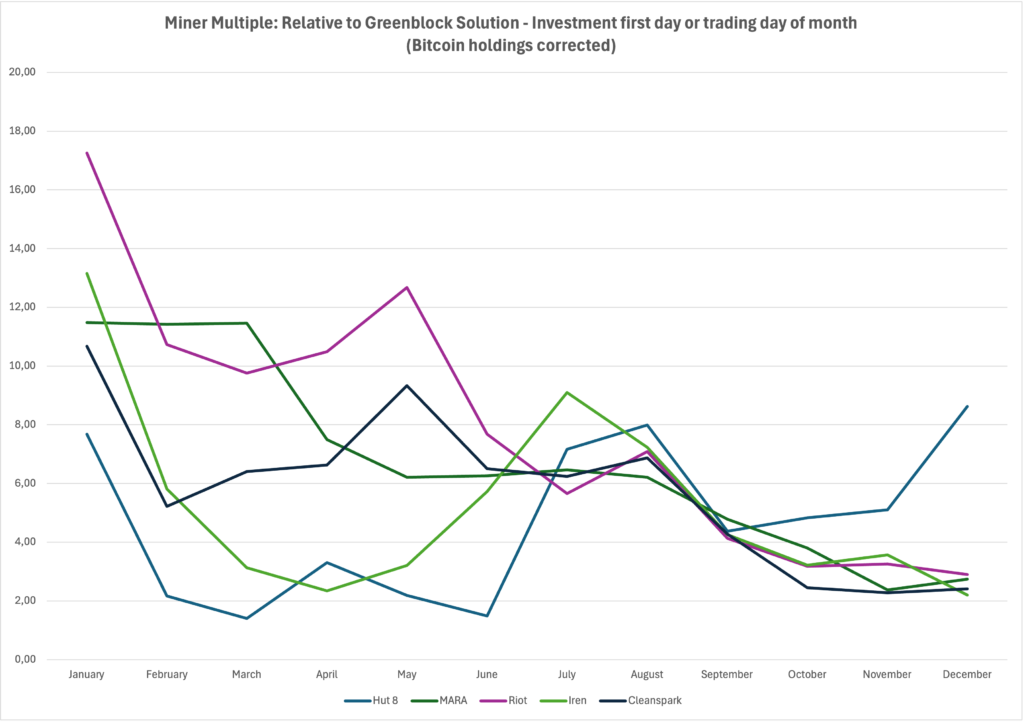
Graph 2: Bitcoin Miner Valuation II (Bitcoin Holdings Corrected)
For illustration, if two companies mine 100 Bitcoin monthly but Company A holds an additional 100 Bitcoin, Company A’s higher stock price may reflect its Bitcoin treasury rather than a lower mining efficiency.
Considering Bitcoin holdings has a significant impact on Bitcoin miner multiples. This becomes particularly apparent when looking at Graph 2 and Graph 4. Before considering Bitcoin holdings there were big differences in multiples. The gaps decrease after accounting for Bitcoin holdings, particularly during the last half of the years.
While our methodology brings us closer to the operational performance, several other factors remain outside the scope of this analysis, including announced mining orders and strategic operational decisions such as Riot’s curtailment program. These elements, while significant to overall company valuation, are not captured in our current operational efficiency metric.
Nevertheless, the metric provides valuable insights into the development of multiples over time and in combination with other data and valuation metrics can guide investors in making more informed investment decisions.
A Brief Look at the Results
Analyzing each movement over time is beyond the scope of this article, so we will keep it rather short and will point out only the most important developments. In future articles, we will be going back to this metric and be able to discuss month-over-month changes in more detail.
What sticks out at the first glance is that overall multiples have gone down over the course of 2024, with investors seemingly pricing in the halving effect on miner profitability.
Only three out of the 12 miners show higher multiples in December compared to the beginning of the year, namely TeraWulf, Hut8 and Core Scientific, with TeraWulf sticking out here. After June its multiple has started to pick-up significantly increasing from 3.65 to over 17 in November but starting to decline steeply again in December. That move coincides with TeraWulf paying off their debt early in July, potentially boosting their share price. Additionally to that earnings have increased by 42.8% in Q3 of 2024.
With multiples coming down for most miners over the course of this year it appears that the market may be less overheated now than around the beginning of the year. Some of the declines seem to be related to the halving event with investors pricing in lower returns.
While for miners in Graph 1 the multiples remain dispersed, we can observe a convergence of multiples for miners in Graph 2 during July, August and September.
Conclusion
Most miners showed declining multiples in 2024, suggesting a market correction from earlier valuations, largely driven by the Bitcoin halving’s impact on profitability. Our GreenBlock-based benchmarking approach helps quantify these valuation trends.
While our analysis provides a standardized framework for comparing production relative to investment, investors should consider that stock prices reflect various factors beyond mining operations, including Bitcoin holdings, future mining orders, and strategic decisions like Riot’s curtailment program.
The evolving industry landscape presents new valuation challenges. Miners are increasingly diversifying beyond traditional operations – holding Bitcoin, raising capital through convertible senior notes, and expanding into AI data centers. Our Bitcoin holdings adjustment methodology helps isolate operational efficiency from treasury strategies, providing clearer insights into miners’ core operations.
The key trend to watch is miners’ transition from pure producers to Bitcoin buyers through convertible senior notes – a shift that could fundamentally change how the market values these companies and their role in the broader Bitcoin ecosystem. Our metric can help isolate this trend and shed more light on miner valuations in the future.
Appendix
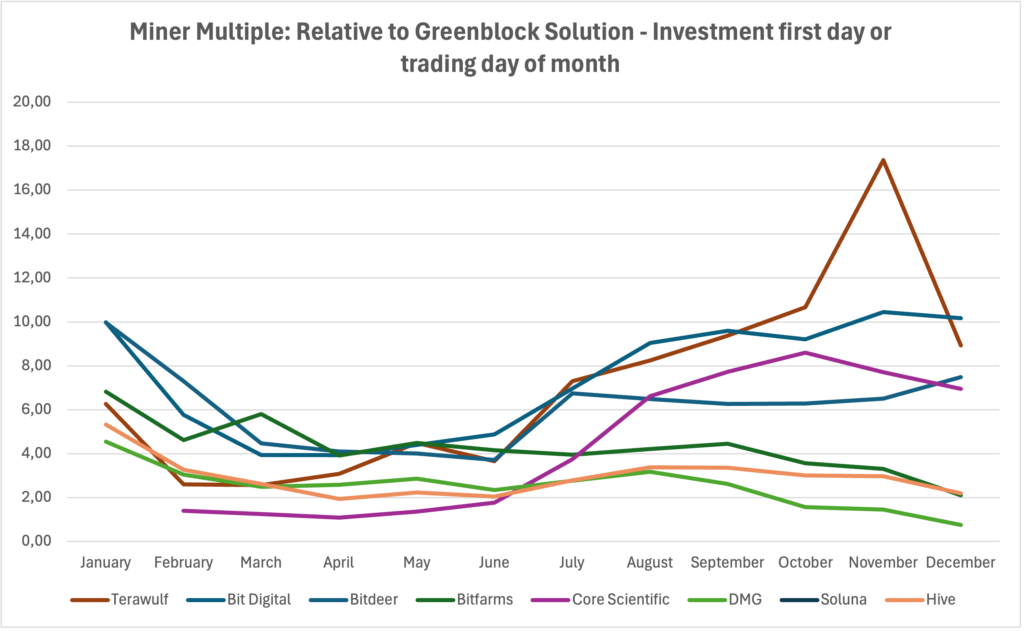
Graph 3: Bitcoin Miner Valuation I
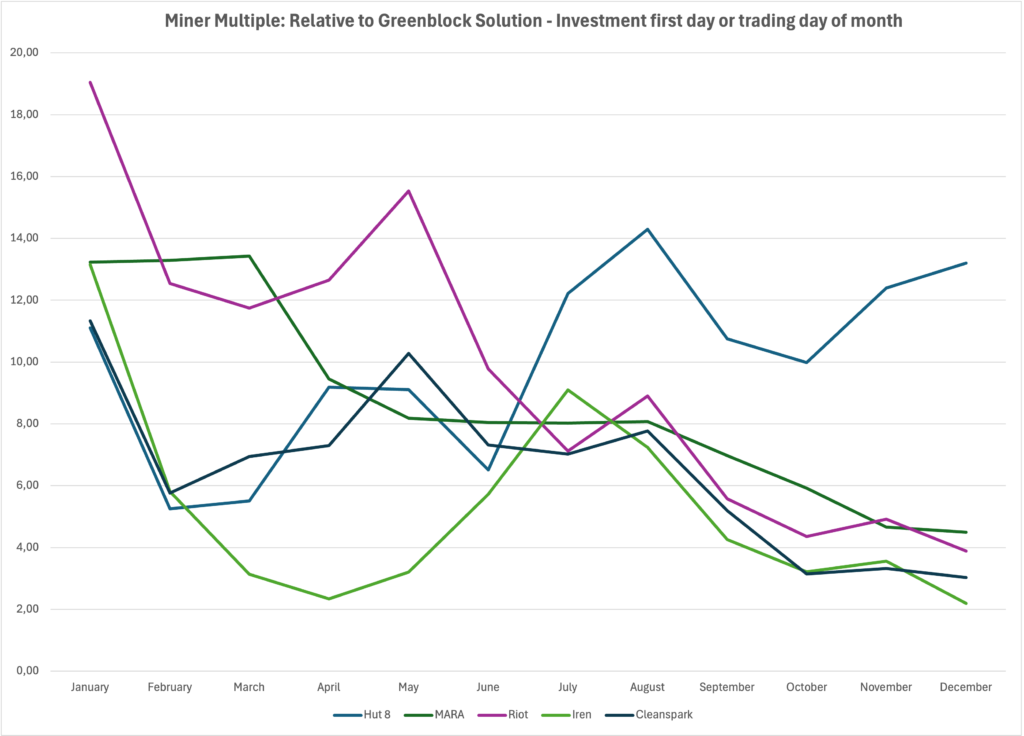
Graph 4: Bitcoin Miner Valuation II